How to Monitor Rinse Conductivity on a Plating Line
Set up a plating rinse conductivity trend with defined sample points, temperature and load records. Use the evidence to specify alarms and rinse controls.
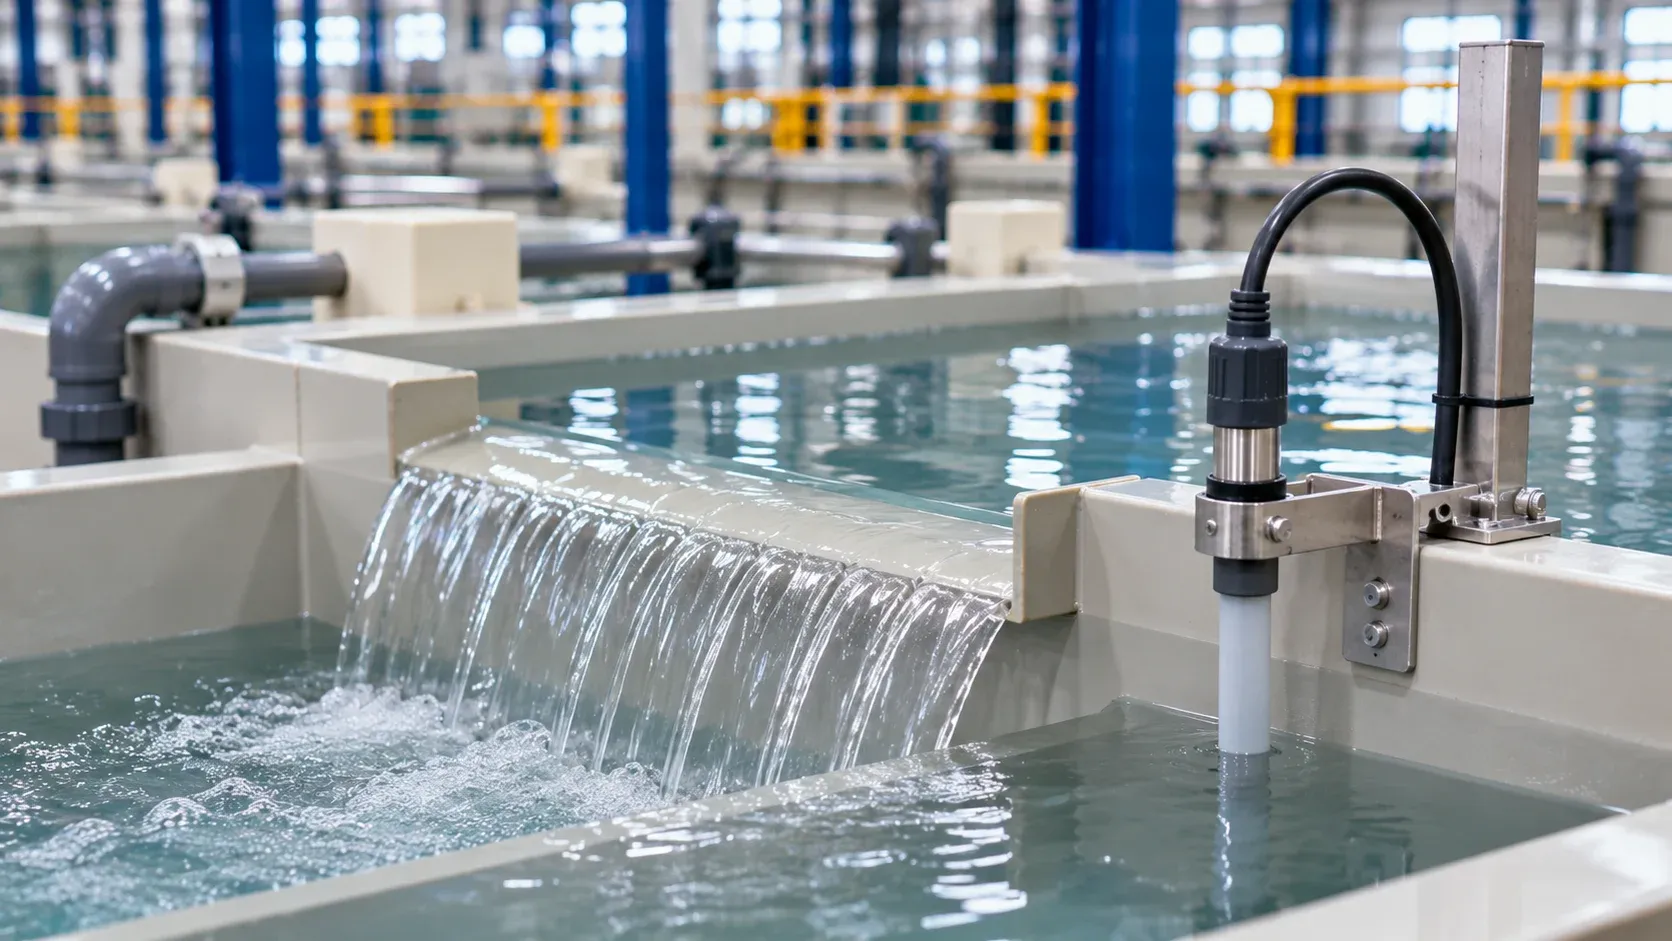
Use rinse conductivity to trend how a defined rinse behaves as work passes through it. Record the sampling point, temperature, feed water and rack activity. Connect the trend to an agreed part or downstream process check before using it to trigger water flow, an alarm or a production decision.
ES-PRO editorial team · Updated 11 November 2026
Conductivity responds to dissolved ions. It can show that the overall ionic condition changed, while identifying a specific contaminant or judging a regulated discharge calls for the applicable method and sampling plan. The EPA metal finishing guide discusses drag-out and conductivity-actuated rinse flow controls as pollution prevention practices.
Give each reading a location and a purpose
Start with the rinse diagram. Mark water entry, overflow direction, part entry and the point where the line obtains its control reading. Identify which stage the reading is intended to represent. In a multi-stage rinse, one tank can behave differently from the final stage. An inlet sample describes the feed water.
At the selected point, document immersion or sampling depth, timing relative to rack movement and whether mixing and flow are operating. A probe near incoming water may respond quickly to fresh feed. A reading near the rack entry may show a short-lived effect of drag-out. Compare against the point and timing specified in the process record.
Question | Useful reading | Context to capture |
|---|---|---|
Did the supply water change? | At the defined feed point | Source, temperature and meter configuration |
Does the rinse recover between loads? | In the monitored rinse at agreed times | Rack arrivals, flow changes, mixing and time since last load |
Did a new part bring more solution into the rinse? | Comparable loaded trials at the same point | Part family, orientation, loading and drain sequence |
Does the following stage remain within acceptance? | The agreed downstream or part check | Use the method and limit set for that requirement |
Establish a baseline before enabling automatic action
Record the readings across representative low and high load conditions within the approved route. Label the part family and the intervals between loads. Include normal changes in source water, replenishment or rinse operation that the team expects to see. Establish the baseline alongside the acceptance check that matters.
Agree how the instrument is checked, how temperature is handled and how a failed sensor is identified. If an inline meter and a handheld meter disagree, first compare their configuration, timing and actual sampling points. A difference between two readings may come from the measurement setup or the rinse itself. Resolve the comparison before changing the process control.
Worked example with two different causes
Suppose the final rinse trend rises on a shift running recessed brackets. The team checks the inlet water and finds the feed reading has shifted too. It also sees that the final rinse spikes after the most heavily loaded racks. Those two observations call for separate comparisons.
Record a stable feed period and compare racks with the same load and transfer timing. Then compare the bracket orientation or drainage in an approved paired trial. Check the downstream condition against the agreed method. If the trend follows the feed, investigate the supply. If it follows the rack event under stable feed conditions, examine drag-out and rinse recovery. Keep both possibilities open until the evidence separates them.
Specify what the controls must do
State where the probe sits, how it can be accessed for checks, and which records the line stores. Name the owner of the setpoint and its change history. Ask for alarm behavior and response when a reading is invalid or unavailable. Agree how an operator can tell that a flow change occurred and whether the process recovered.
In a controlled acceptance demonstration, show a normal reading and an invalid-sensor event. Confirm that the interface distinguishes the two and that the event history records the valve state and the approved fallback. A graph without the flow state can leave the operator unable to explain why a trend changed.
Record rinse/station · reading and units · temperature basis · sample point · rack event · feed condition · water valve state · downstream check · action and owner. A comparison is most useful when the record preserves the process conditions behind the reading. Review the line setup guide and plating pump guide for the wider flow and equipment interfaces.
If the proposal includes treatment or water reuse, use the water treatment equipment category to identify the separate equipment boundary and its required inlet data.
FAQ
What conductivity value should trigger an alarm?
Set it with the process owner using the specific rinse, measurement point, baseline and acceptance evidence.
Can conductivity show which chemical carried over?
Use it to flag an ionic trend. Use the agreed analytical method when you need to identify or quantify a particular constituent.
Can I use the same threshold on the first and last rinse?
Set each threshold for its own stage and duty. Use comparable records to confirm how the stages behave together.
Discuss rinse monitoring for a plating line
Share the rinse diagram and the control decision you need. Include the part mix, feed water and existing measurement points. Send diagrams by sales email, or discuss the project on WhatsApp.
Image note: AI-generated editorial photography illustrates equipment or workpiece contexts; it is not an ES-PRO installation, customer reference or evidence of coating performance.